Converts the C history array from the mELO output to a data.frame. Useful for plotting diagnostics.
c_array_as_df(c_mat_array)
Arguments
| c_mat_array | The history of C matrix values for a mELO rating model. |
|---|
Value
A data.frame.
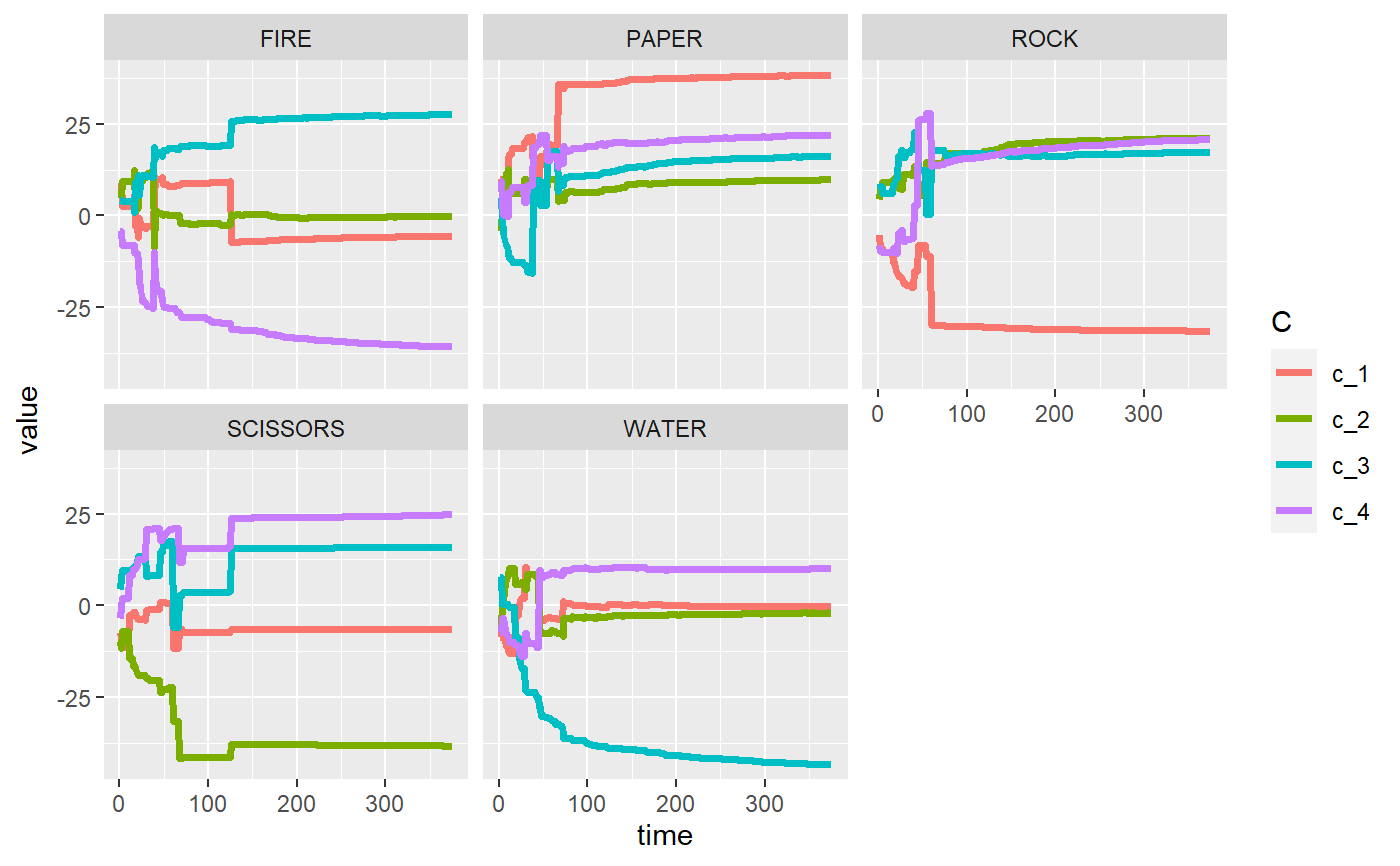
Examples
# rock paper scissors fire water model rpsfw_model <- mELO(rpsfw_df, k=2) c_mat_df <- c_array_as_df(rpsfw_model$c_mat_history) head(c_mat_df)#> Player time c_1 c_2 c_3 c_4 #> 1 FIRE 1 8.807558 4.656891 4.043954 -4.179362 #> 2 FIRE 2 8.807558 4.656891 4.043954 -4.179362 #> 3 FIRE 3 2.628271 9.329291 3.968360 -8.138085 #> 4 FIRE 4 2.628271 9.329291 3.968360 -8.138085 #> 5 FIRE 5 2.628271 9.329291 3.968360 -8.138085 #> 6 FIRE 6 2.628271 9.329291 3.968360 -8.138085# Plot the evolution of C vectors for each throw # Make data a bit 'tidyer' tidy_c_mat_df <- tidyr::gather( c_mat_df, key = "C", value = "value", -time, -Player ) ggplot2::ggplot(tidy_c_mat_df, ggplot2::aes(x=time,y=value,colour=C)) + ggplot2::geom_line(size=1.25) + ggplot2::facet_wrap(~Player)