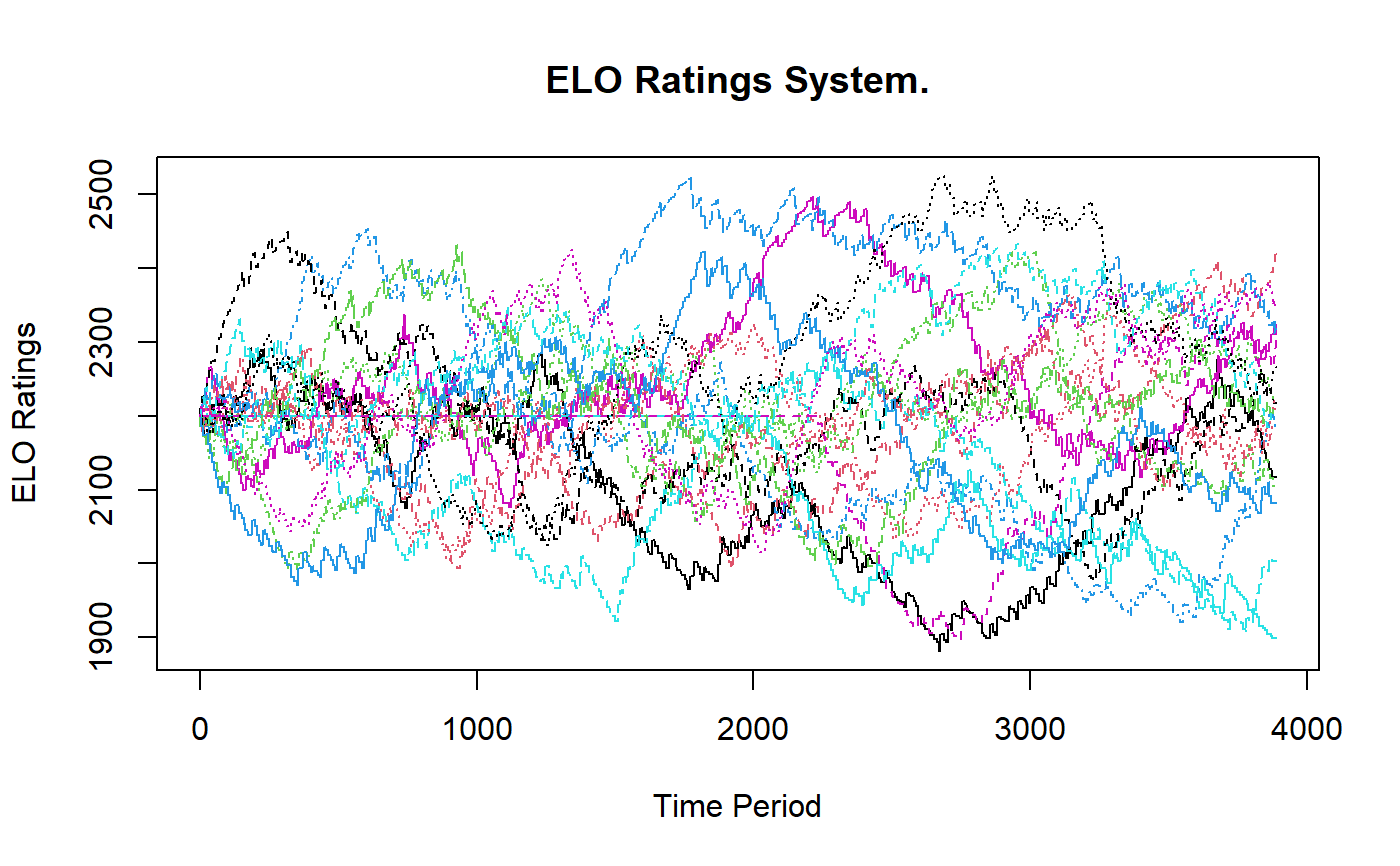
Plot historical player ratings for a mELO_rating object
Source:R/plot.mELO_rating.R
plot.mELO_rating.Rd# S3 method for mELO_rating plot( modelled_ratings, xlab = "Time Period", ylab = paste(modelled_ratings$type, "Ratings"), main = NULL )
Arguments
| modelled_ratings | An object of class |
|---|---|
| xlab | Title for x axis. |
| ylab | Title for y axis. |
| main | Title for the plot. |
| x_labels | Custom labels for the x axis. |
Value
a plot
Examples
#> # A tibble: 6 x 7 #> match_index home_team away_team outcome date home_score away_score #> <int> <chr> <chr> <dbl> <date> <int> <int> #> 1 1 Richmond Melbourne 1 2000-03-08 94 92 #> 2 2 Essendon Port Adela~ 1 2000-03-09 156 62 #> 3 3 North Melbou~ West Coast 0 2000-03-10 111 154 #> 4 4 Adelaide Footscray 0 2000-03-11 108 131 #> 5 5 Fremantle Geelong 0 2000-03-11 107 129 #> 6 6 St Kilda Sydney 0 2000-03-12 100 134